max.
=max.
鈩?/div>
0.1
0.01
t
p
(ms)
0.1
V
TM
(V)
1.00
10.00
0.0
0.5
1.0
1.5
2.0
2.5
3.0
3.5
4.0
4.5
5.0
0.10
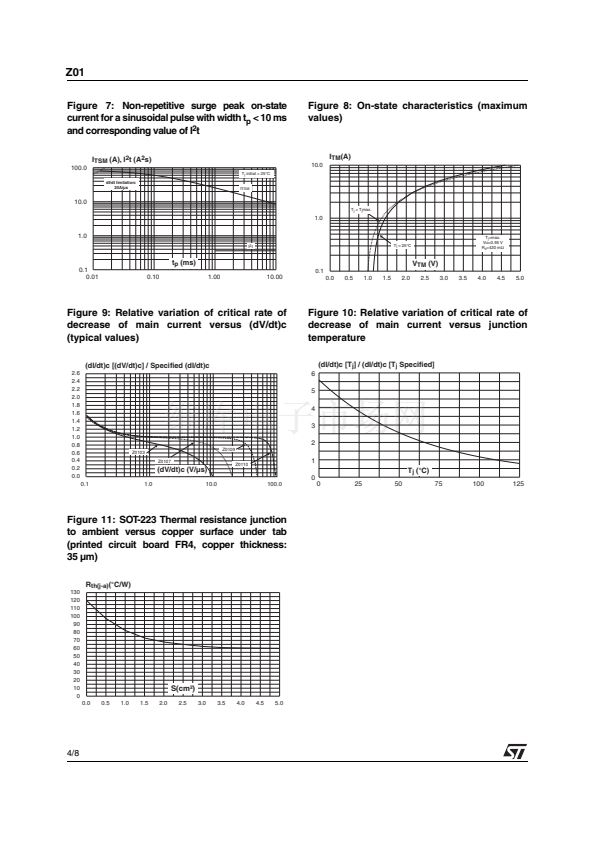
Figure 9: Relative variation of critical rate of
decrease of main current versus (dV/dt)c
(typical values)
(dI/dt)c [(dV/dt)c] / Specified (dI/dt)c
2.6
2.4
2.2
2.0
1.8
1.6
1.4
1.2
1.0
0.8
0.6
0.4
0.2
0.0
0.1
Figure 10: Relative variation of critical rate of
decrease of main current versus junction
temperature
(dI/dt)c [T
j
] / (dI/dt)c [T
j
Specified]
6
5
4
3
2
Z0103
Z0107
Z0109
Z0110
1
(dV/dt)c (V/碌s)
0
1.0
10.0
100.0
T
j
(擄C)
0
25
50
75
100
125
Figure 11: SOT-223 Thermal resistance junction
to ambient versus copper surface under tab
(printed circuit board FR4, copper thickness:
35 碌m)
R
th(j-a)
(擄C/W)
130
120
110
100
90
80
70
60
50
40
30
20
10
0
0.0
0.5
1.0
1.5
2.0
S(cm虜)
2.5
3.0
3.5
4.0
4.5
5.0
4/8


 1
1
 2
2
 3
3
 4
4
 5
5
 6
6
 7
7
 8
8
