Z01 Series
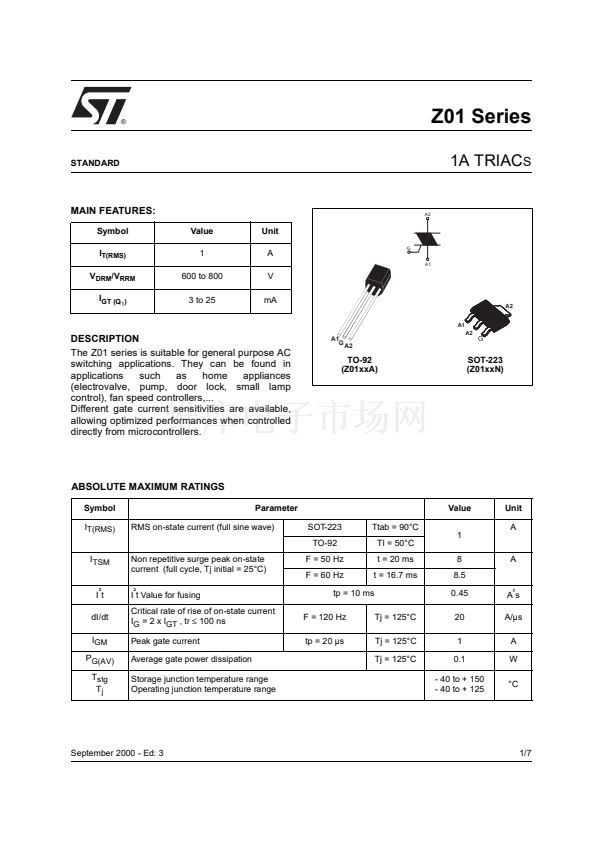
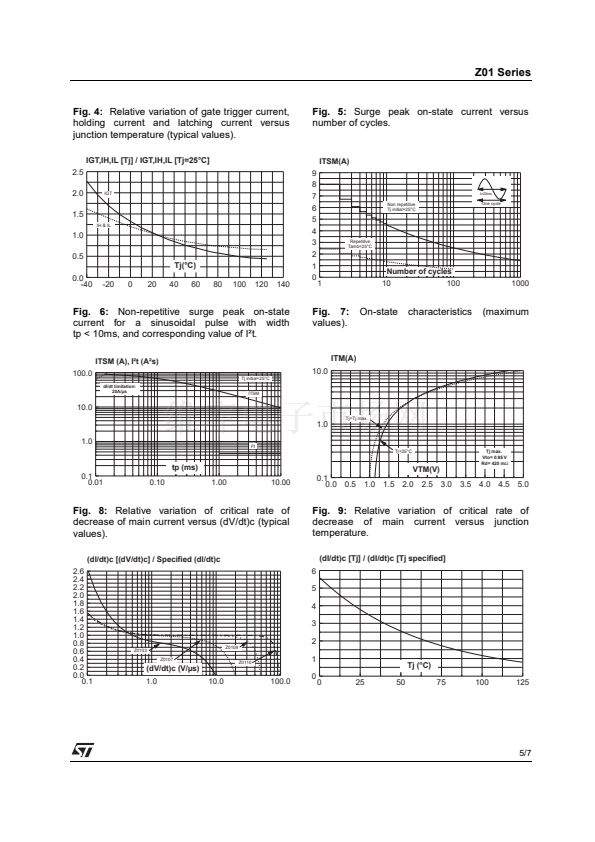
Fig. 4:
Relative variation of gate trigger current,
holding current and latching current versus
junction temperature (typical values).
IGT,IH,IL [Tj] / IGT,IH,IL [Tj=25擄C]
2.5
2.0
1.5
IH & IL
IGT
Fig. 5:
Surge peak on-state current versus
number of cycles.
ITSM(A)
9
8
7
6
5
4
3
2
1
0
t=20ms
Non repetitive
Tj initial=25擄C
One cycle
1.0
0.5
Tj(擄C)
0.0
-40
-20
0
20
40
60
80
100
120
140
Repetitive
Tamb=25擄C
Number of cycles
1
10
100
1000
Fig. 6:
Non-repetitive surge peak on-state
current for a sinusoidal pulse with width
tp < 10ms, and corresponding value of I虜t.
ITSM (A), I虜t (A虜s)
100.0
dI/dt limitation:
20A/碌s
Fig. 7:
values).
On-state
characteristics
(maximum
ITM(A)
10.0
Tj initial=25擄C
ITSM
10.0
Tj=Tj max.
1.0
1.0
I虜t
Tj=25擄C
tp (ms)
0.1
0.01
0.10
1.00
10.00
VTM(V)
0.1
0.0 0.5 1.0 1.5 2.0 2.5 3.0 3.5 4.0 4.5 5.0
Tj max.
Vto= 0.95 V
Rd= 420 m鈩?/div>
Fig. 8:
Relative variation of critical rate of
decrease of main current versus (dV/dt)c (typical
values).
(dI/dt)c [(dV/dt)c] / Specified (dI/dt)c
2.6
2.4
2.2
2.0
1.8
1.6
1.4
1.2
1.0
0.8
0.6
0.4
0.2
0.0
0.1
Fig. 9:
Relative variation of critical rate of
decrease of main current versus junction
temperature.
(dI/dt)c [Tj] / (dI/dt)c [Tj specified]
6
5
4
3
2
Z0103
Z0107
Z0109
Z0110
1
100.0
(dV/dt)c (V/碌s)
Tj (擄C)
0
25
50
75
100
125
1.0
10.0
0
5/7


 1
1
 2
2
 3
3
 4
4
 5
5
 6
6
 7
7
